If you’re getting into crypto trading, learning how to read candlestick charts is one of the most important skills you can develop. These charts help you analyze price movement, spot trends, and make smarter buy or sell decisions—without needing to be an expert.
In this beginner’s guide, we’ll break down what candlesticks mean, how to read them, and key patterns you should know.
🕯️ What Is a Candlestick Chart?
A candlestick chart is a visual representation of price movements over a certain time frame (e.g., 1 minute, 1 hour, 1 day). Each candlestick shows:
-
The opening price
-
The closing price
-
The highest price
-
The lowest price
Each candle tells you what happened in the market during that time period.
🧠 How to Read Trends Using Candlesticks
-
🔼 Uptrend (Bullish): Higher highs and higher lows
-
🔽 Downtrend (Bearish): Lower highs and lower lows
-
➡️ Sideways (Consolidation): Flat highs and lows
Use multiple candles in a row to identify trend direction. Don’t rely on a single candlestick.
📌 Basic Candlestick Patterns for Beginners
1. Doji
-
Open and close are nearly the same
-
Shows market indecision
-
Might signal a trend reversal
2. Hammer
-
Small body, long lower wick
-
Appears at bottom of a downtrend
-
Signals potential bullish reversal
3. Shooting Star
-
Small body, long upper wick
-
Appears at top of an uptrend
-
Signals bearish reversal
4. Bullish Engulfing
-
Large green candle covers previous red candle
-
Strong buy signal
5. Bearish Engulfing
-
Large red candle covers previous green candle
-
Strong sell signal
🔧 Tools to Read Crypto Charts
Popular platforms that show candlestick charts:
-
TradingView (Free + Pro options)
-
Binance (In-app charts)
-
CoinMarketCap / CoinGecko
-
CoinDCX, WazirX, KuCoin apps
🧠 Pro Tip: Add indicators like RSI, MACD, or Moving Averages to combine with candles for stronger signals.
📚 Candlestick Reading Tips for Beginners
-
✅ Always combine candlestick patterns with volume and trend context
-
✅ Use longer timeframes for reliable setups
-
❌ Don’t rely on one candle alone
-
✅ Practice with paper trading before risking real money
-
✅ Keep a trading journal of patterns you spot and results
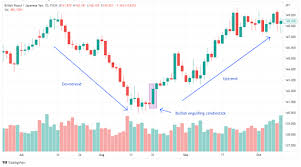
📈 Practice Example
Let’s say you see this on the 1-day BTC/USDT chart:
-
A long red candle followed by a green hammer with high volume
👉 This could be a bullish reversal—a good entry point if supported by other indicators.
Learning to read candlestick charts can dramatically improve your crypto trading decisions. Whether you’re day trading or investing long-term, understanding price behavior through candles helps you avoid emotional mistakes.