One of the most important skills in crypto trading is knowing when to enter and when to exit a trade. Timing the market perfectly is difficult—even for pros—but with the right tools and techniques, you can make smarter decisions that improve your results and minimize losses.

In this guide, you’ll learn how to find the best entry and exit points using charts, technical indicators, and simple strategies.
🚪 What Are Entry and Exit Points?
-
Entry Point = When you decide to buy a cryptocurrency.
-
Exit Point = When you decide to sell it (either for profit or to cut losses).
Choosing the right time can maximize your profits and reduce your risk—especially in crypto’s highly volatile markets.
🧠 Step 1: Understand Market Structure
Before using indicators, you need to identify:
-
Trend direction: Is the price going up, down, or sideways?
-
Support levels: Price zones where buyers step in
-
Resistance levels: Price zones where sellers push the price down
🧭 Tip: Never enter a trade blindly—understand the bigger picture using the 1D or 4H charts first.
📥 How to Find the Best Entry Points
1. 🟢 Buy at Support Levels
-
Wait for the price to bounce near a known support zone (e.g., previous low)
-
Look for confirmation: bullish candle, volume spike, RSI recovery
2. 📈 Use RSI (Relative Strength Index)
-
RSI below 30 = oversold (possible bounce incoming)
-
Combine with support level for stronger signal
3. 🔄 Use Moving Averages
-
Price crossing above the 50-day or 200-day MA = bullish signal
-
Golden Cross: 50 MA crosses above 200 MA = long-term buy signal
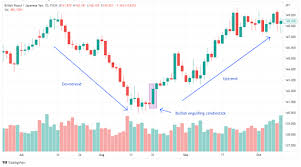
4. 🪞 Look for Reversal Candlestick Patterns
-
Bullish engulfing, hammer, morning star
-
These patterns near support zones are solid entry hints
5. 💬 Watch for News & Breakouts
-
A positive announcement or breakout from consolidation = possible entry
-
Wait for confirmation (volume spike, retest)
📤 How to Identify Good Exit Points
1. 🔴 Sell at Resistance Levels
-
If price approaches a strong resistance, expect potential reversal
-
Set target profit zones just below resistance
2. 🧮 Use Fibonacci Extensions
-
Plot Fib levels after a strong upward move
-
Use 1.618 or 2.0 levels as profit targets
3. 📉 Watch RSI (Again)
-
RSI above 70 = overbought (possible correction)
-
Combine with resistance or bearish candle for exit signal
4. 📊 Volume Drop with Price Rise
-
If price goes up but volume decreases = weakening momentum
-
Consider taking profits before a reversal
5. ⛑️ Use Stop-Loss and Take-Profit Orders
-
Always set a stop-loss below support
-
Set a take-profit at resistance or based on risk/reward ratio (e.g., 2:1)
📚 Example: Spotting Entry/Exit for Ethereum (ETH)
-
ETH drops to ₹1,80,000, near a strong support
-
RSI = 28 (oversold), hammer candle forms
-
Entry Point: ₹1,82,000 with stop-loss at ₹1,75,000
-
ETH rises to ₹2,10,000 near resistance + RSI = 70
-
Exit Point: ₹2,05,000 to ₹2,08,000
🧠 Risk/Reward: 1:3 (very good setup)
🚫 Common Mistakes to Avoid
-
❌ Entering after a huge green candle (FOMO buying)
-
❌ Selling too early out of fear
-
❌ Not setting stop-loss or take-profit levels
-
❌ Ignoring overall market trend
📈 Bonus Strategy: The 3-Point Checklist
Before any trade, ask:
-
✅ Is the price near a key support/resistance level?
-
✅ Do indicators (RSI, MACD, MA) confirm the direction?
-
✅ Is volume supporting the move?
If all three align—you’ve got a strong entry or exit opportunity.
Mastering entry and exit points is all about combining:
-
Chart analysis
-
Indicators
-
Psychology
-
Risk management
You don’t need to be perfect—but the more you learn and practice, the better your timing will get.